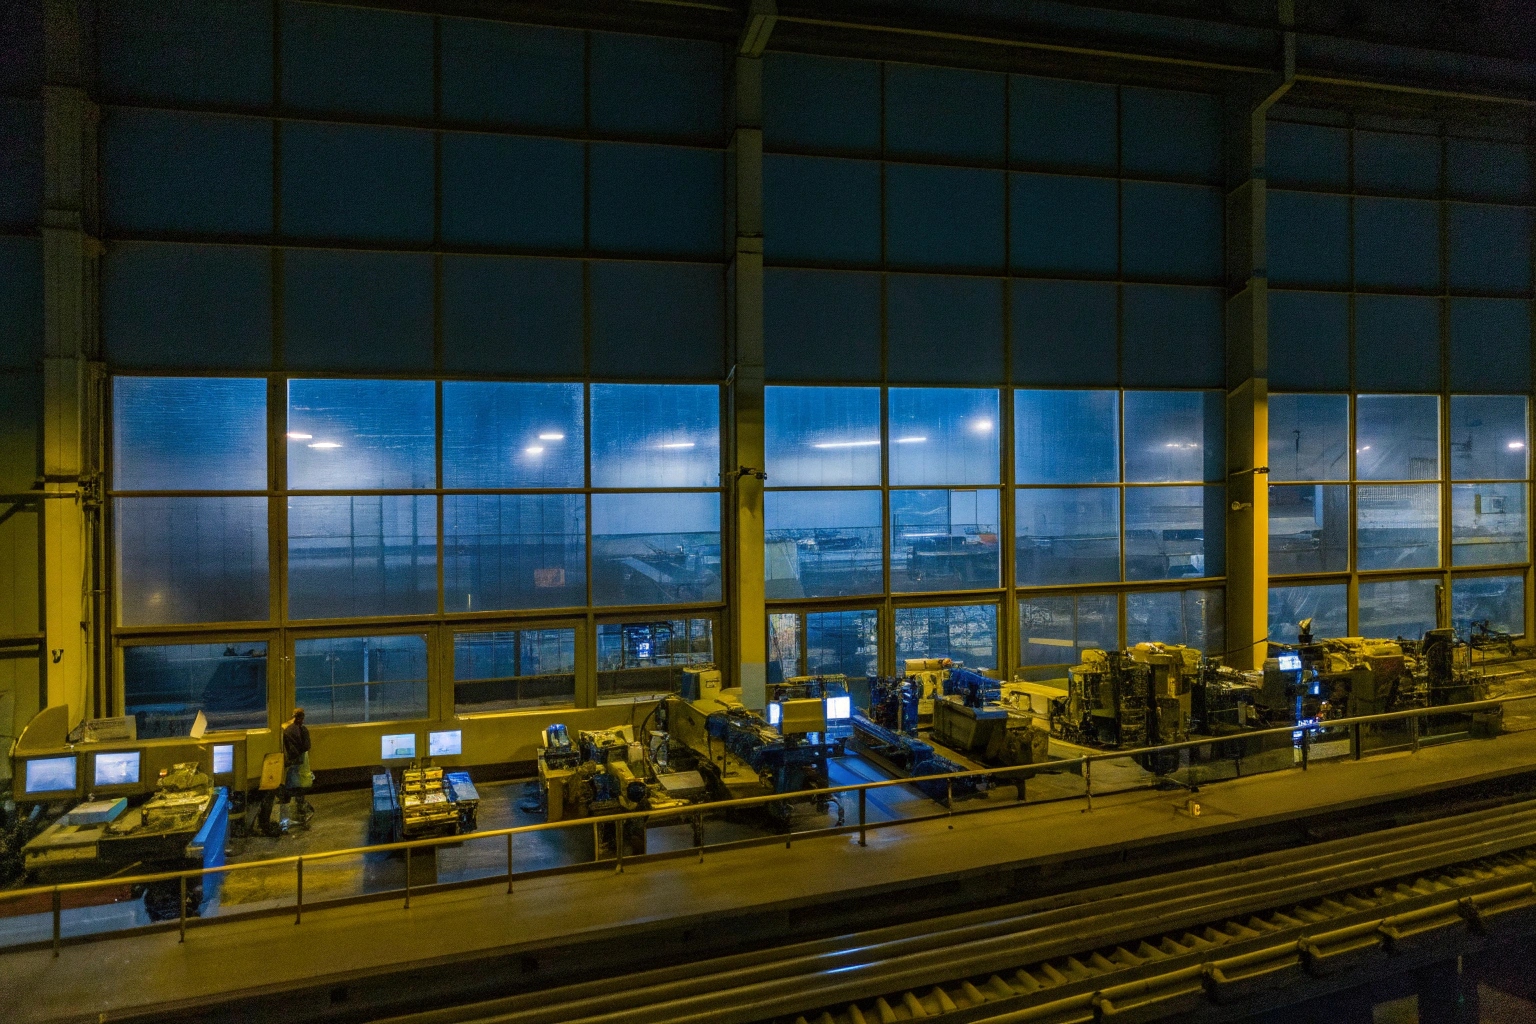
Understanding our monthly production capacity and process bottlenecks is vital for effective planning of your orders. These factors directly influence the maximum order volume we can handle for your undercarriage parts for excavators & bulldozer 1.
Our facility’s monthly capacity ranges between 3,500 to 4,000 tons, with specific production constraints defined by forging 2, heat treatment, and precision machining phases 3.
Can I See a Capacity Map Across Forging, Machining, and Hardening for My Plan?
A comprehensive capacity map across key manufacturing stages enhances planning precision, accommodating your specific order volume requirements.
Yes, here’s a detailed capacity map for forging, machining, and hardening phases, ensuring your orders are seamlessly integrated into our production cycle.
Capacity maps delineate phase inputs, improving scheduling precision 4.
Capacity Map
| Manufacturing Phase | Capacity (Units per Month) | Constraints |
|---|---|---|
| Forging | High-volume capacity for small to medium-sized parts | Equipment scheduling |
| Machining | Flexible capacity with CNC capabilities | Specialized machine availability |
| Hardening | Fixed cubic volume due to furnace limitations | Energy constraints |
Mapping capacity ensures informed decision-making in order scaling.
Phase-by-phase capacity visualization aids in reconciling forecasted demands efficiently.
Will You Add Shifts or Subcontract Approved Processes if I Scale Up?
Adding shifts or subcontracting parts of the process enhances production flexibility, accommodating increases in demand.
Yes, we can expand operations through additional shifts 5 and subcontracted processes to support your scaled production needs 6.
Operational scaling through labor adjustments optimizes response to increased orders.
Scaling Operations
| Expansion Tactic | Description | Order Management Success |
|---|---|---|
| Shift Augmentation | Utilizes extended hours for increased throughput | Elevates production volume |
| Process Subcontracting | Engages third-party expertise for specialized tasks | Enhances process flexibility |
Adapting production strategies meets scaling demands, ensuring capacity maximization.
Operational shifts and subcontracting boost throughput for high-order influxes.
Do You Maintain Takt Time Data to Forecast My Order Throughput?
Maintaining takt time data 7 supports precise throughput forecasting, aligning manufacturing with projected demand curves.
Yes, we maintain takt time data that provides essential insights for forecasting order throughput efficiently.
Takt time metrics optimize workflow alignment with order demands.
Forecasting Through Key Metrics
| Takt Time Utilization | Description | Optimization Efficiency |
|---|---|---|
| Real-Time Takt Data | Captures essential cycle times for production phases | Predicts throughput with precision |
| Variable Forecasting | Integrates data for dynamic demand response | Supports order planning accuracy |
Integrating takt data forecasts operational capabilities, balancing order flow effectively.
Takt analysis ensures flexible production responses mirroring demand shifts.
Historical on-time delivery (OTD) data ensures informed expectations regarding lead times for volumes comparable to yours.
Yes, we can provide historical OTD data 8, illustrating delivery patterns and performance outcomes for similar volumes.
Historical OTD insights ensure transparency in delivery performance.
OTD Performance Benchmarks
| Volume Analysis | Description | Delivery Consistency |
|---|---|---|
| Historical OTD Data | Provides clarity on scheduled deliverables | Evaluates timing expectations |
| Delivery Trends | Depicts patterns for similar volume throughput | Guides strategic planning |
Historical delivery metrics yield strategic insights into anticipated timing for orders.
Analyzing OTD benchmarks informs order capacity expectations, enhancing client satisfaction.
Conclusion
Through capacity mapping, operational scaling, takt time utilization, and historical delivery analysis, we optimize monthly production capacity for your undercarriage parts for excavators & bulldozer, efficiently handling maximum order volumes that meet your strategic needs.
Footnotes
1. Undercarriage parts are key components in heavy machinery. ↩︎
2. Forging is a critical phase affecting production capacity. ↩︎
3. Precision machining ensures component quality and affects throughput. ↩︎
4. Capacity maps help refine scheduling across production phases. ↩︎
5. Additional shifts expand capacity, meeting demand increases. ↩︎
6. Subcontracting processes build production flexibility. ↩︎
7. Takt time data forecasts production throughput precisely. ↩︎
8. Historical OTD data informs delivery expectations. ↩︎


